2015 Case Study | Stratix Corp
iTrac360
My Role
UX Research
- Consume secondary research artifacts provided by the product team
- Identify key personas, their pain points & goals.
UX Design
- Build artifacts to define the product experience
- Create user stories and work with Software Engineers to define functional requirements
UI Design
- In pursuit of an MVP produce sketches & low fidelity wireframes
- Identify the technology stack and provide direction on front end design patterns
Challenges
- Gathering and leveraging useful analytics and reporting for devices and lifecycle trends.
- Asset information is tracked manually in spreadsheets with complex and infrequent reporting.
- No single portal or mechanism to submit and track device Return Materials Authorization (RMAs) and repair status.
Goals
- Create a visual dashboard that uses charts / graphs to display KPIs at a glance.
- Give users a robust toolset to create specific views of datasets that inform the product lifecycle.
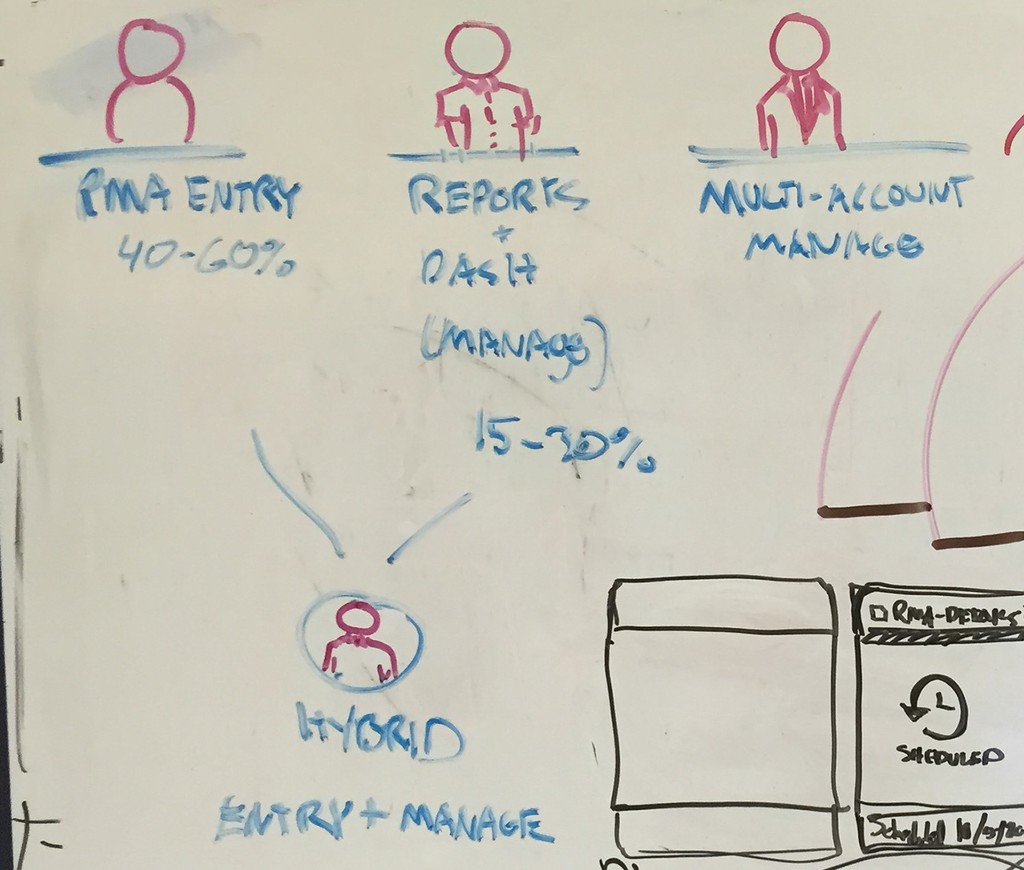
Personas
RMA Entry User : RMAs are reports on the lifecycle of a product deployed by Stratix, which is in use by one their clients.
Managers : Responsible for overseeing the product lifecycle from deployment to return & repair.
- Need ability to quickly generate data sets with the ability to filter/ sort and save
- Need robust tool to create data visuals
Multi Account Managers : Responsible for communication with clients, rely on account managers for key insights. - Want quick insight into KPIs at a glance
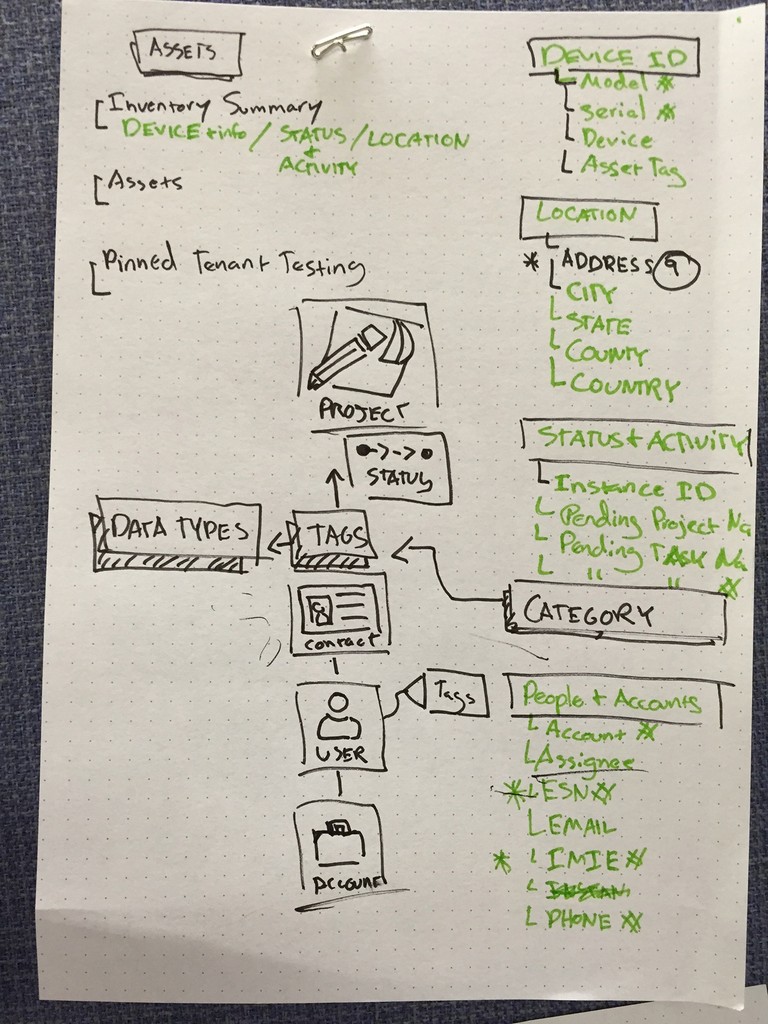
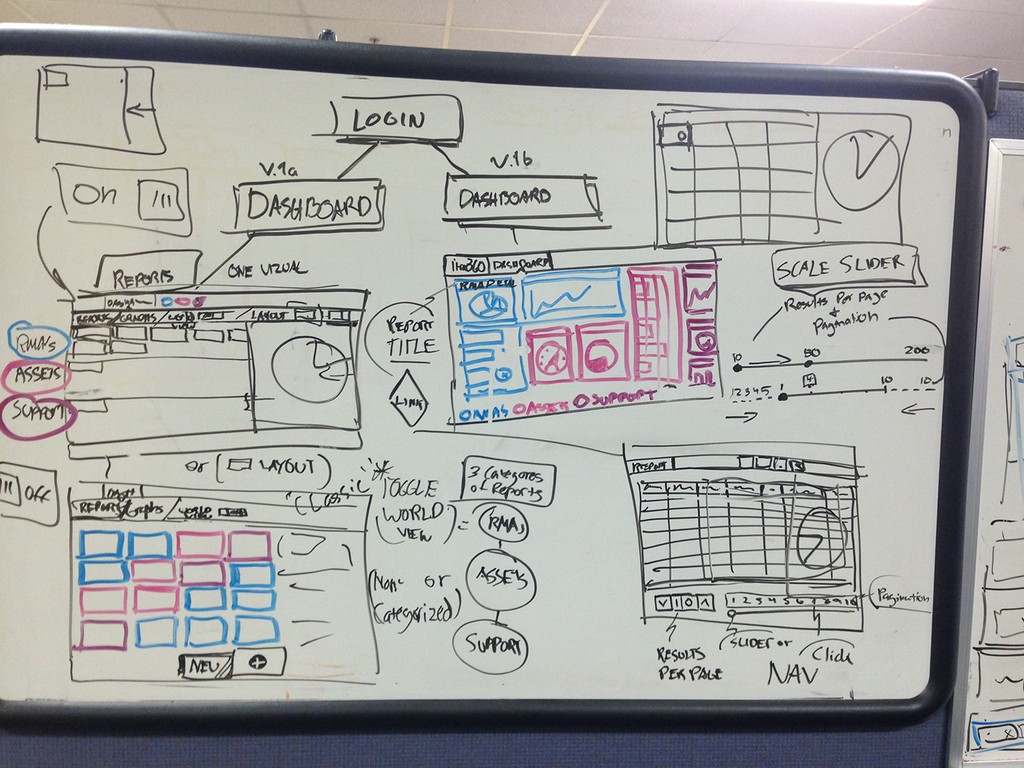
Dashboard & Cards
The dashboard should be highly modular, and there should be pre-defined datasets with configured visuals to encourage users to create their own.
We will be using bootstrap and the card layout can take advantage of flex box for layout purposes. Users should be able to arrange cards in different sizes and shapes according to their priority and visual type.
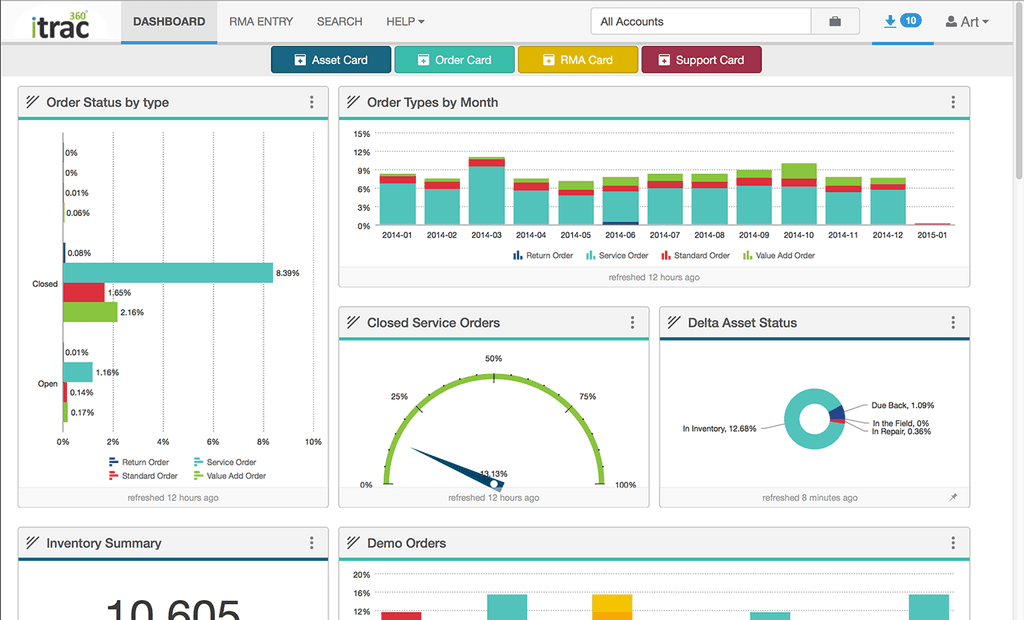
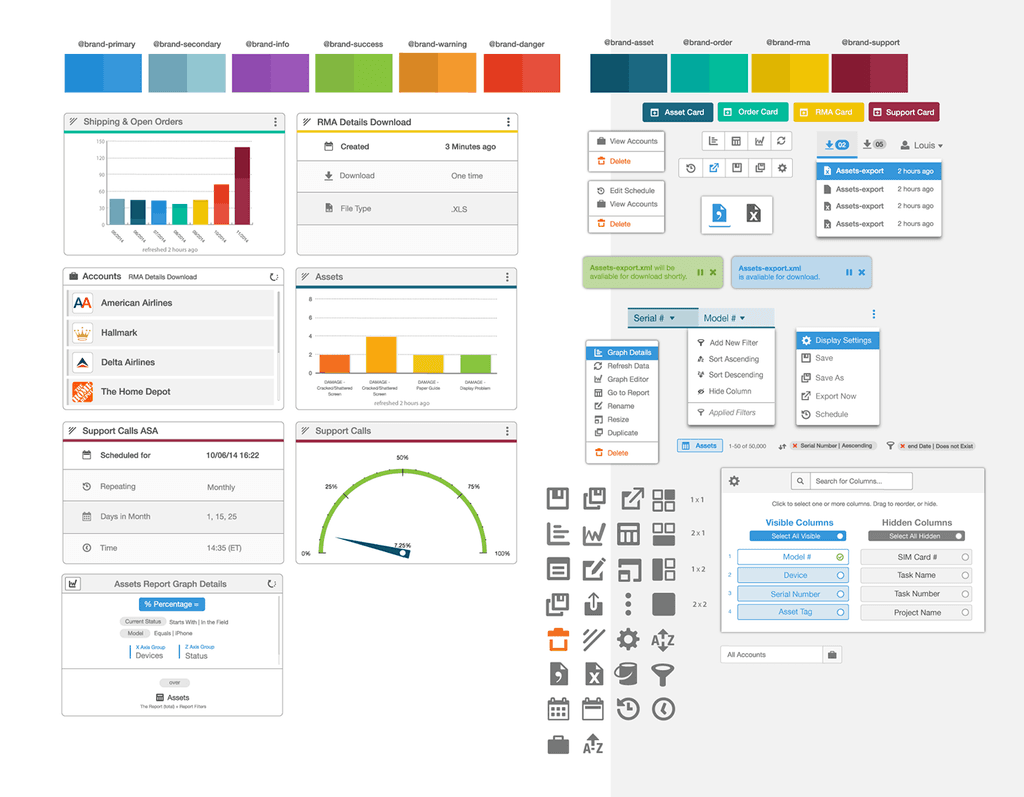
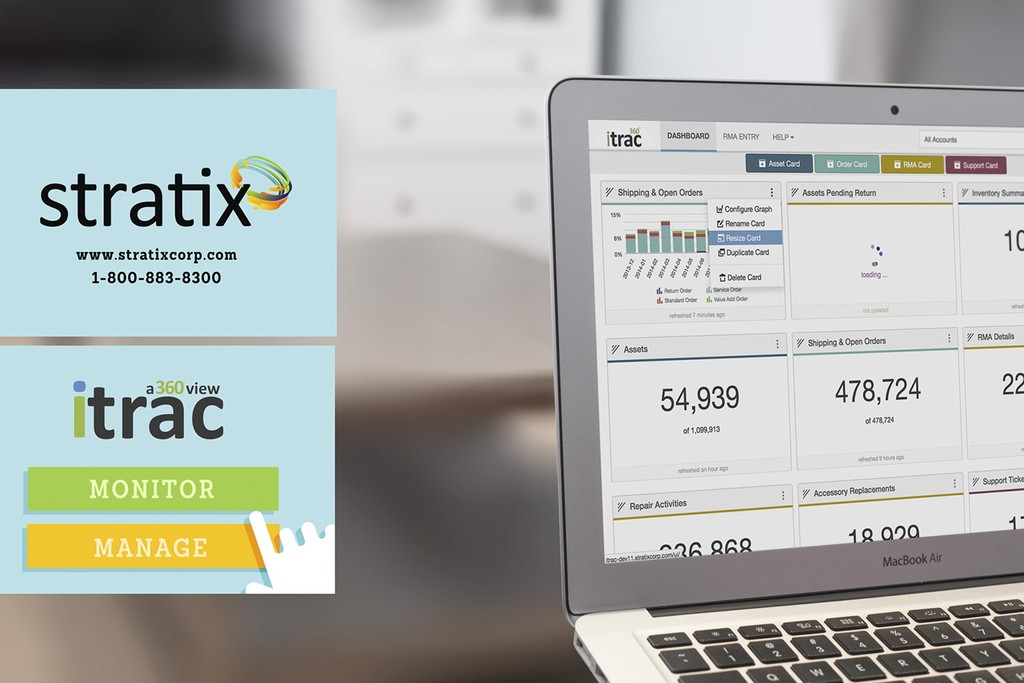
Dashboard Design
Pictured above(left) is the final design for the dashboard. The subnav contains 4 buttons which are assigned identifying colors, these buttons will produce new cards that have pre-defined content filters. This gives the user a starting point to create their reports. We chose these categories based on high level user needs.
1. Assets - Detailed view of serialized items that are located In the Field or at Stratix categorized by current status.
2. Order - Detailed information on pending and received orders
3. RMA - Comprehensive RMA history of Assets by Reported, Received and Shipped segments.
4. Support - Dataset focused on devices linked to tech support tickets created by customers
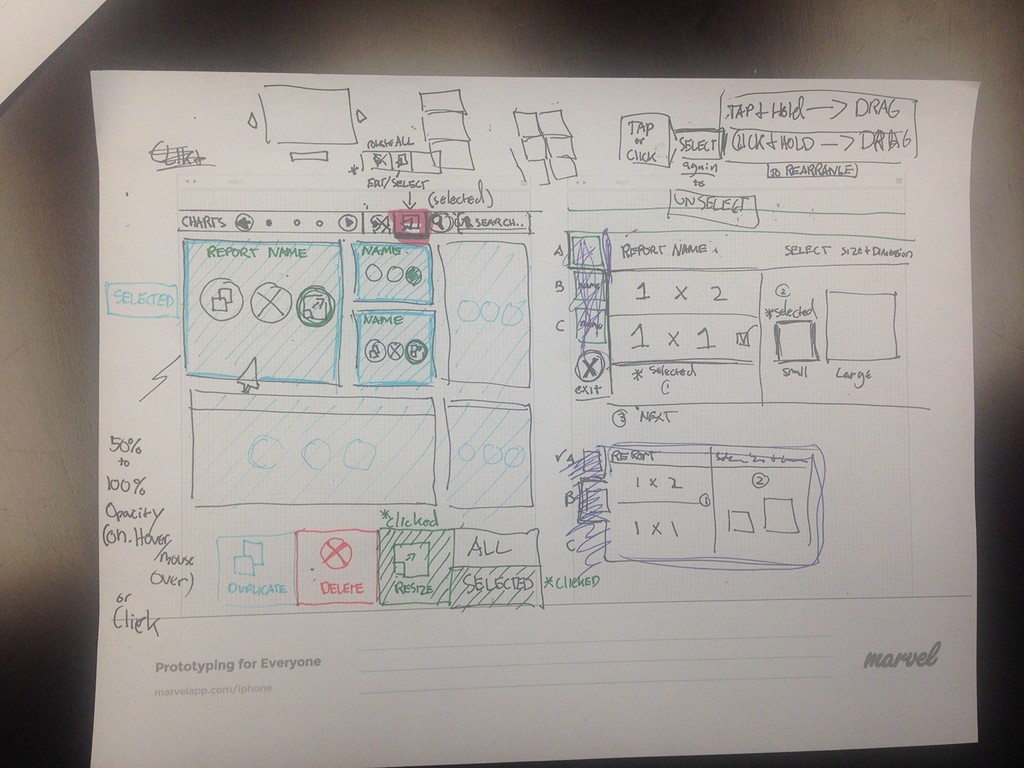
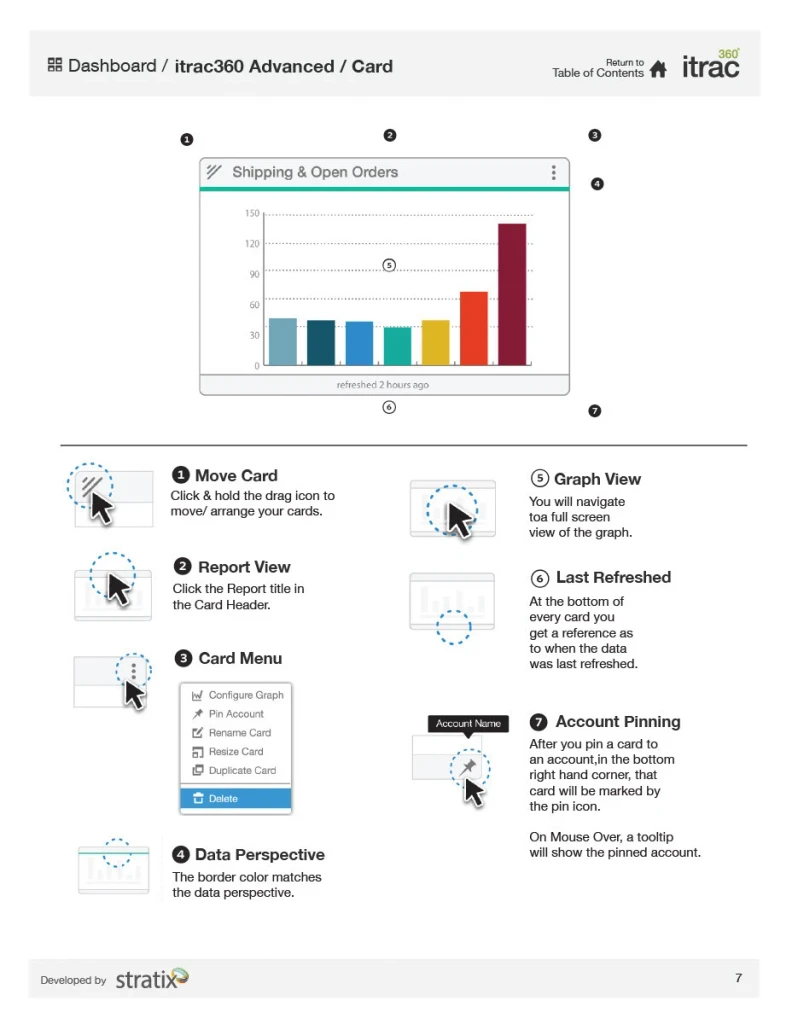
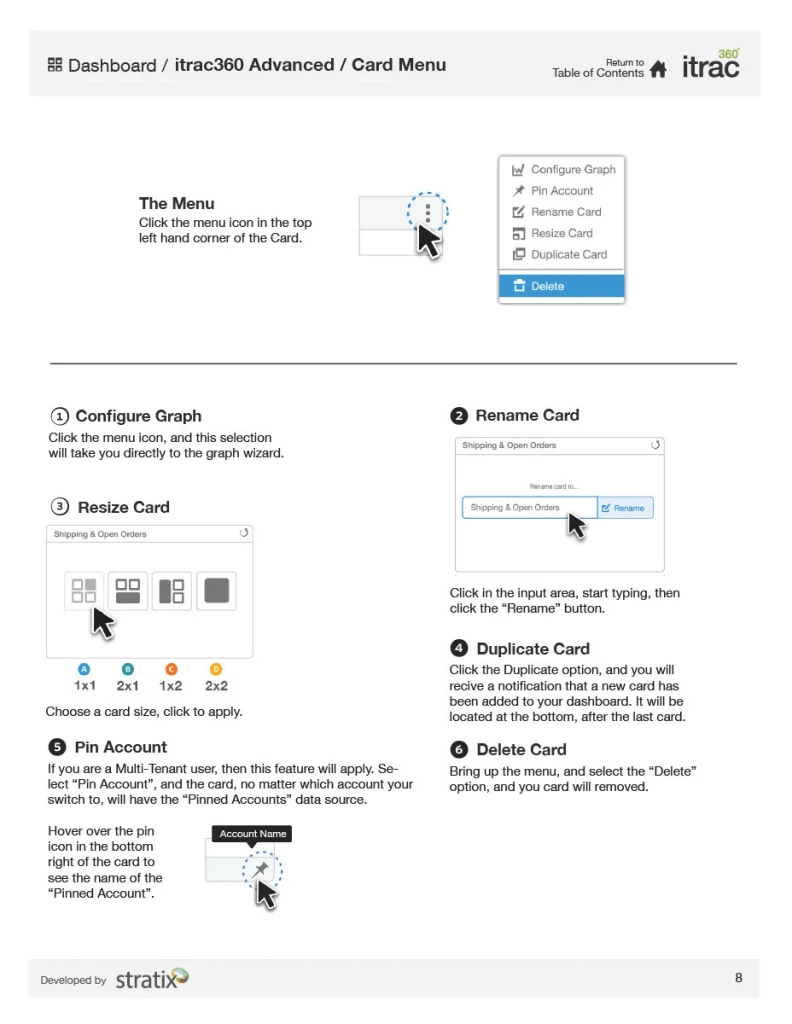
Pictured below is documentation for the dashcard component
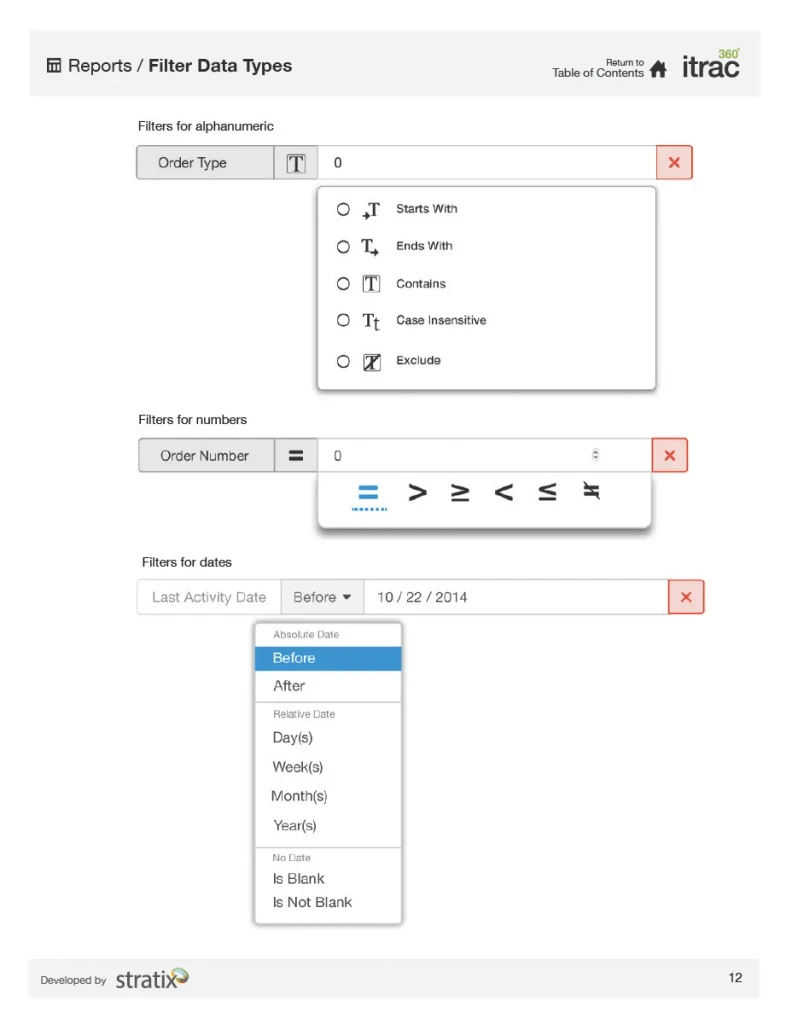
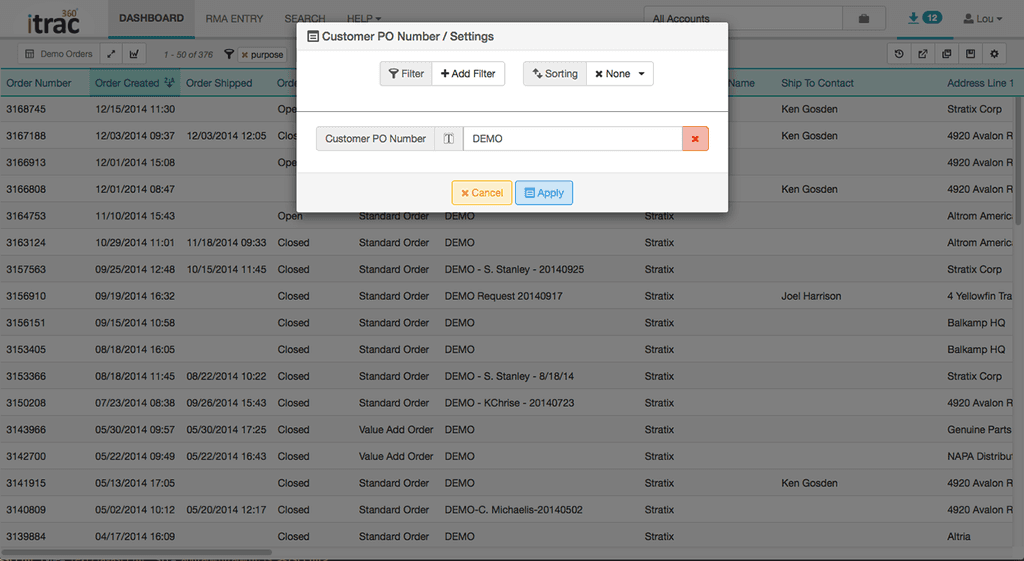
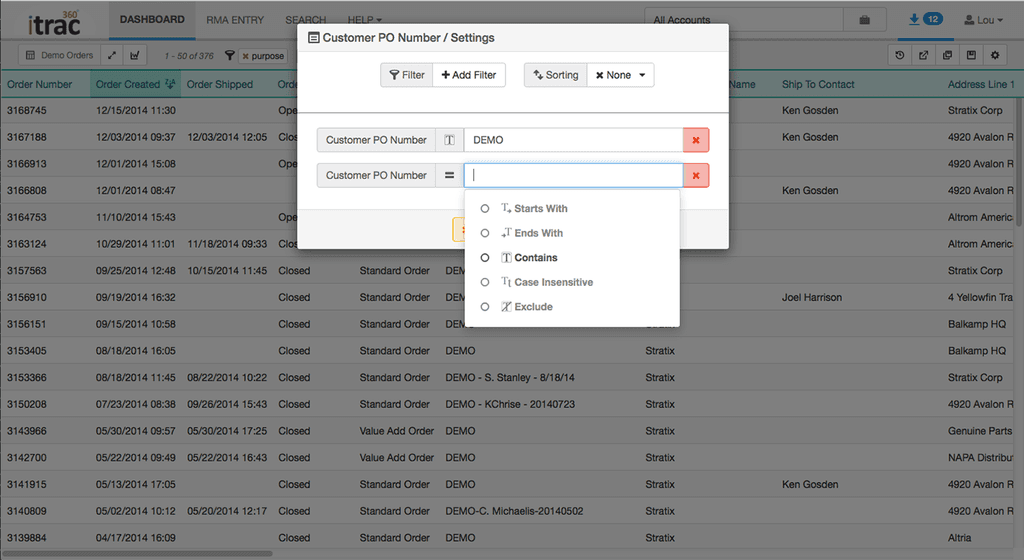
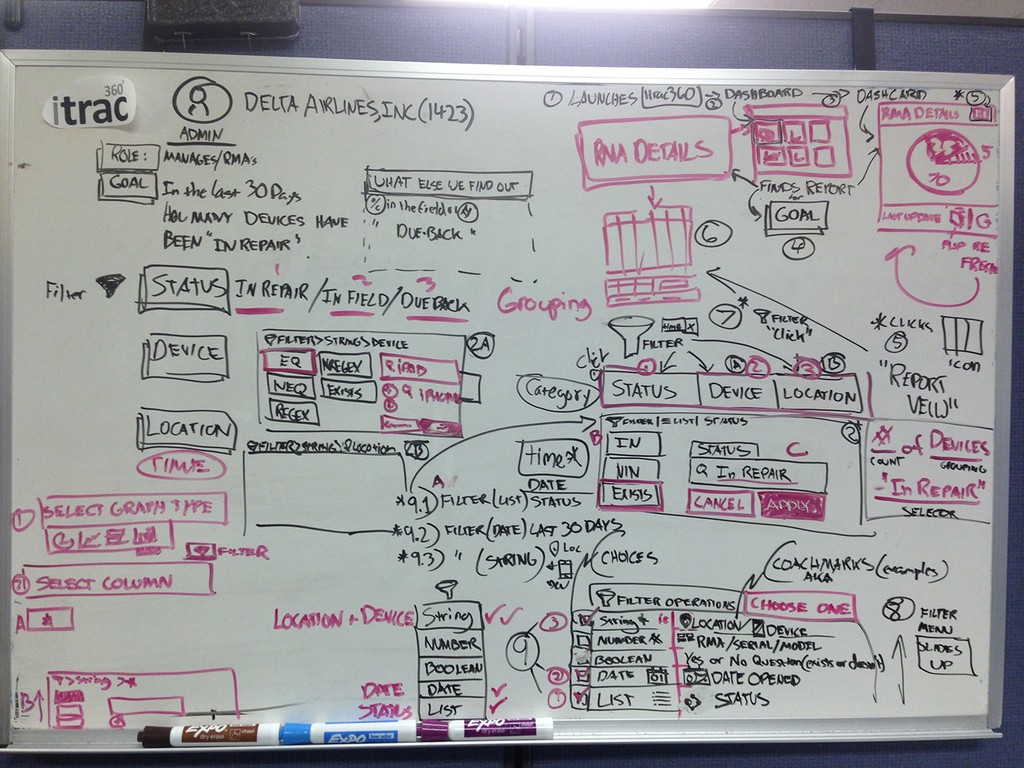
Report Configuration: Filters & Sorts
This spreadsheet view is where Managers can configure the dataset for their specific needs.
- Users can create regular expression filters to shape the dataset
- Multiple sorts can be applied to align the data with a specific point of view
Goal: Create a toolset that is intuitive, but powerful enough so that users can stay in the context of the web application without having to use Excel.
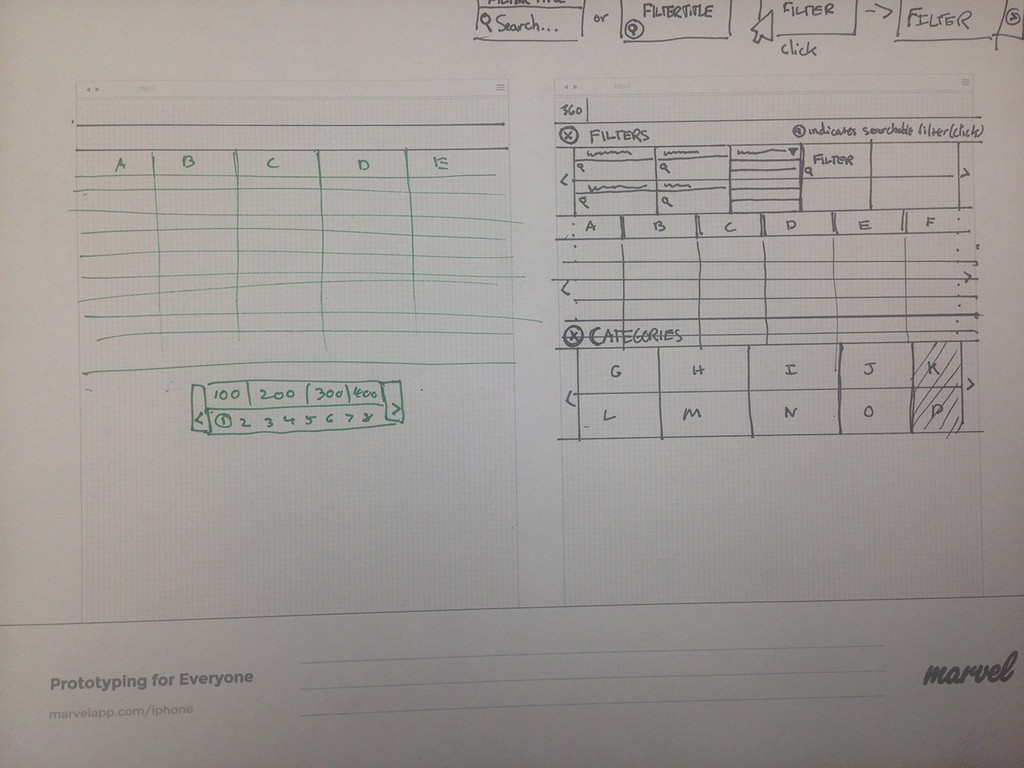
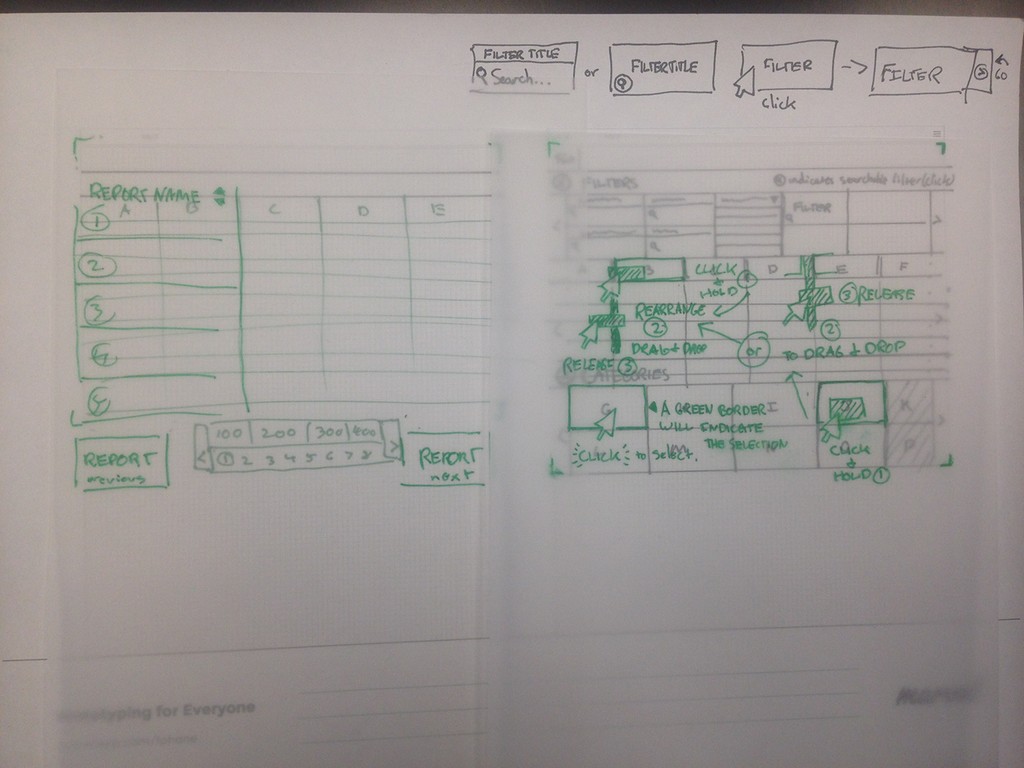
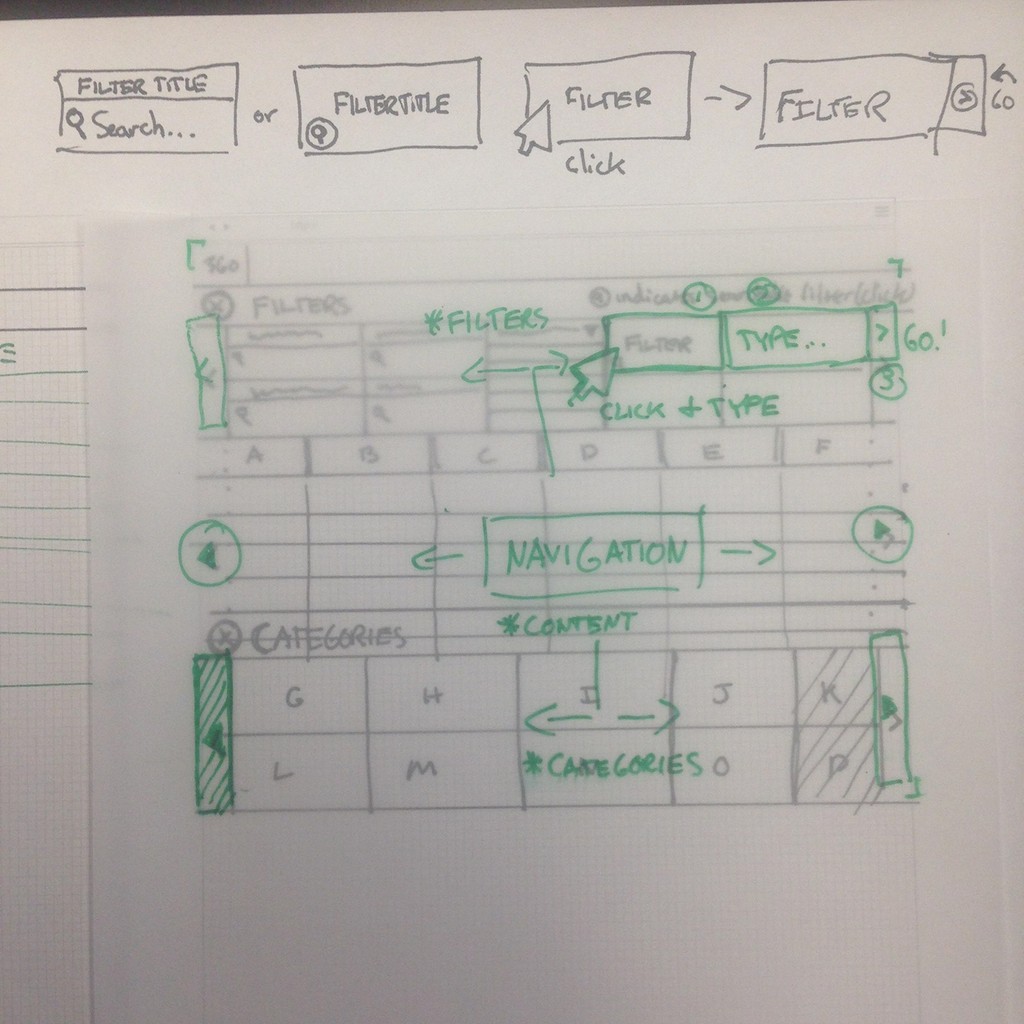
(Above) Sketches showing ideation of how users can apply filters and rearrange columns in a dataset.
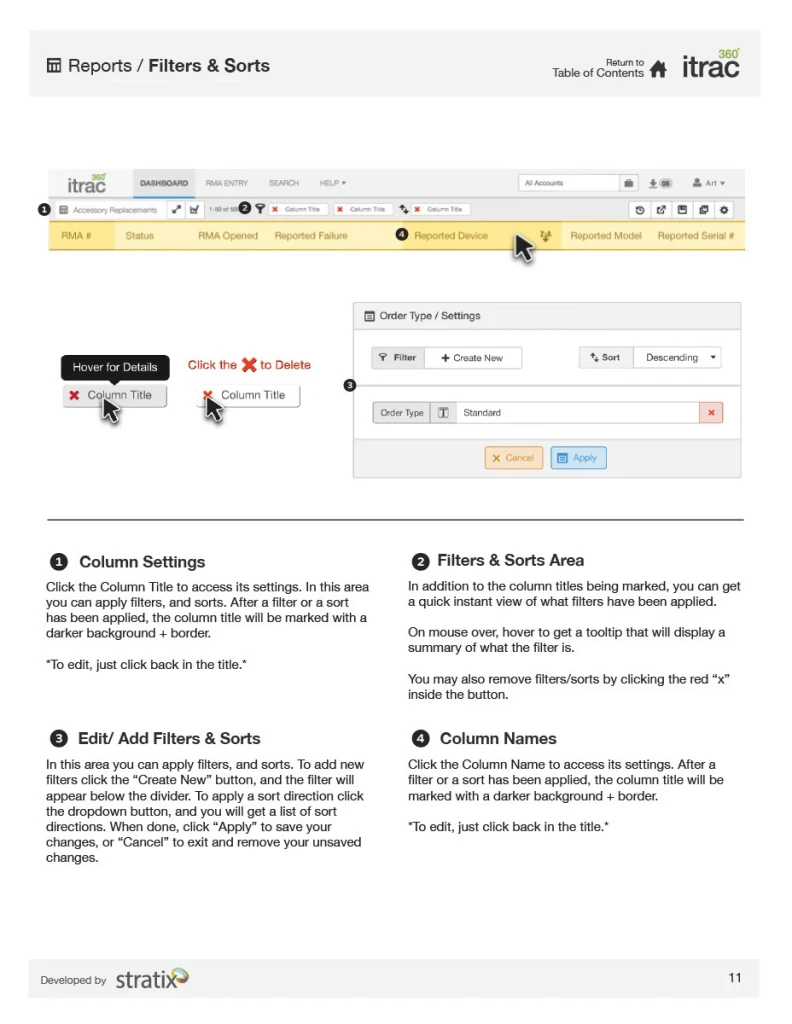
(Below) Regular expression filters and sorts documentation.
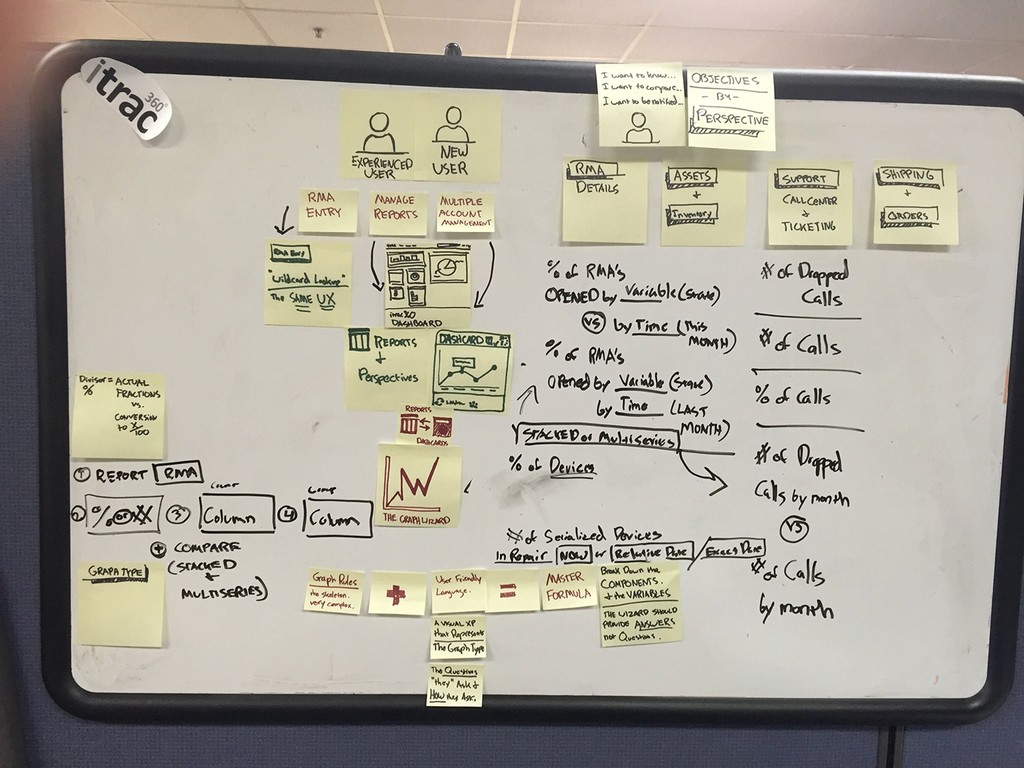
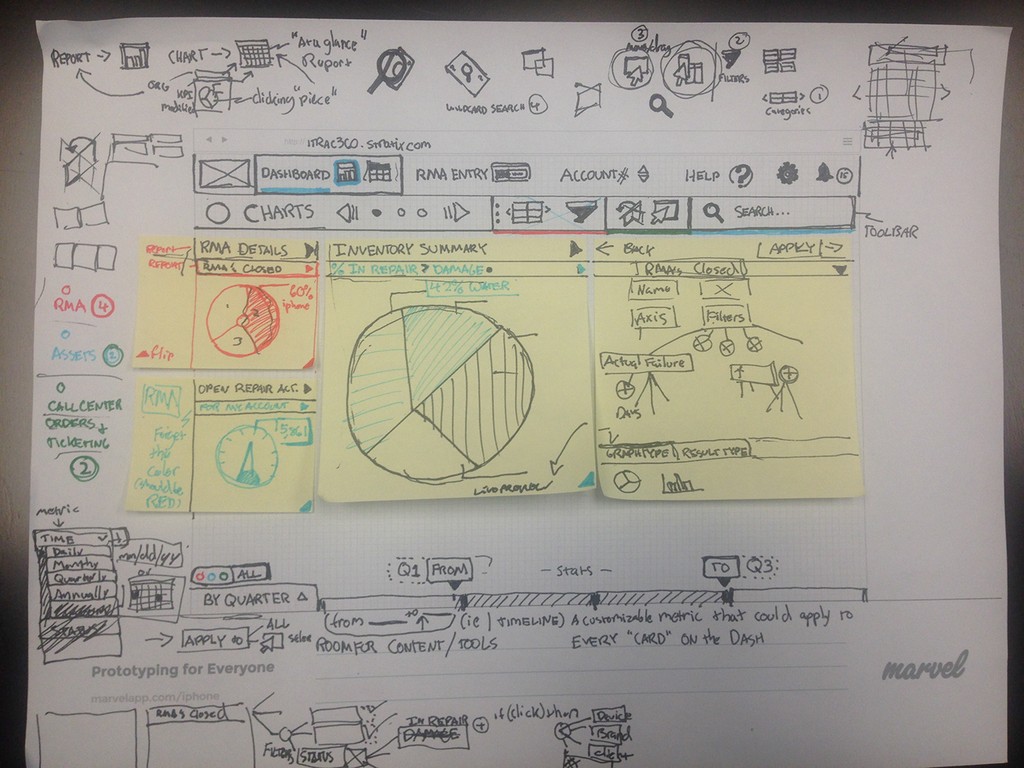
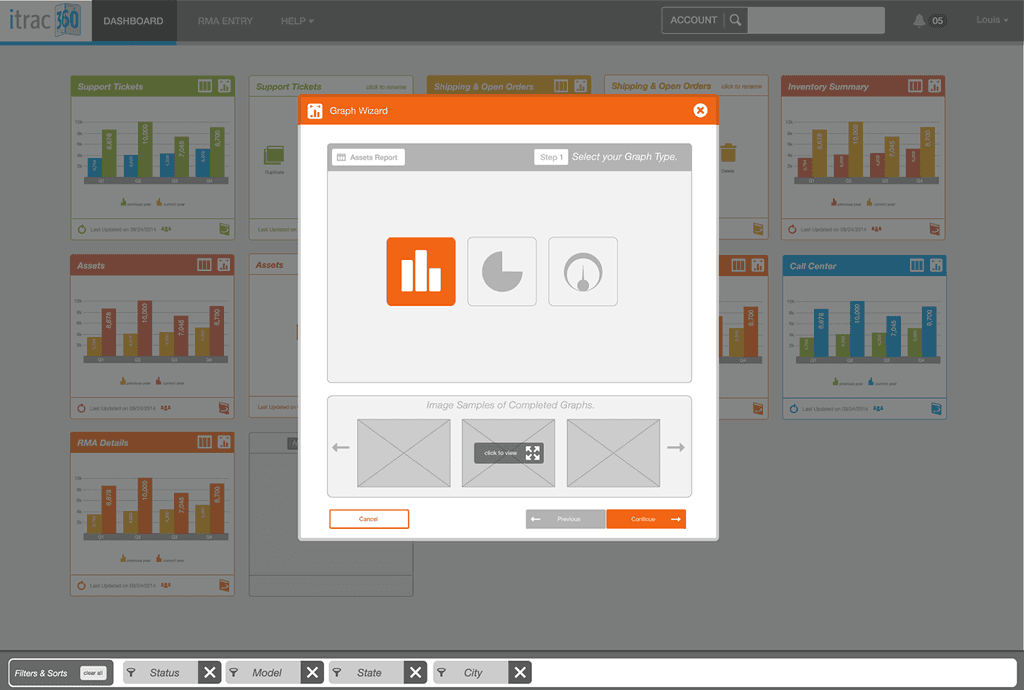
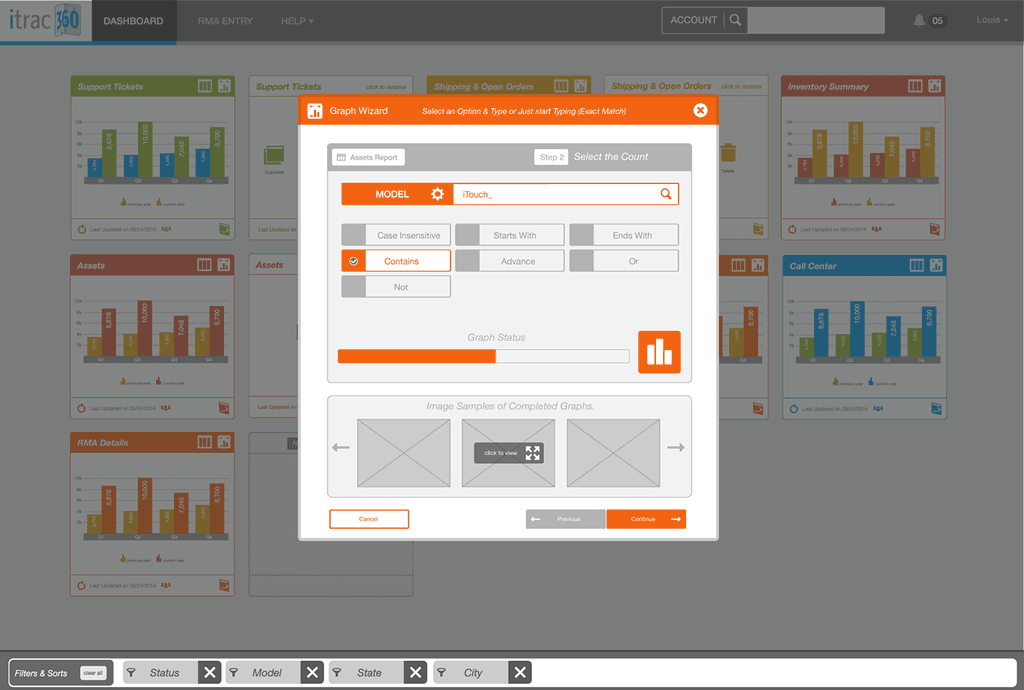
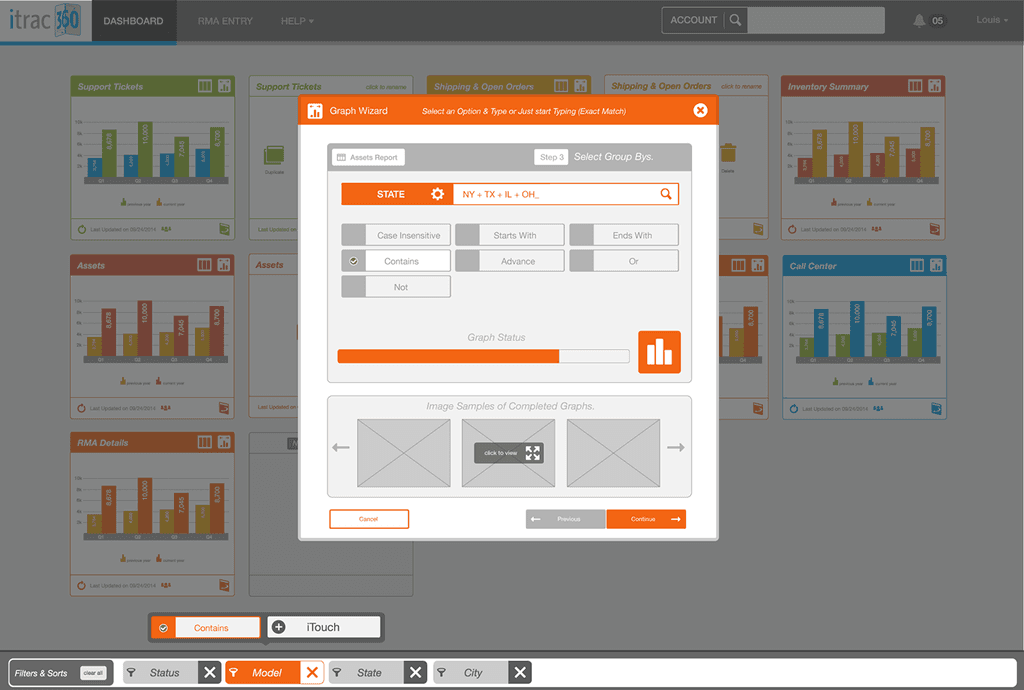
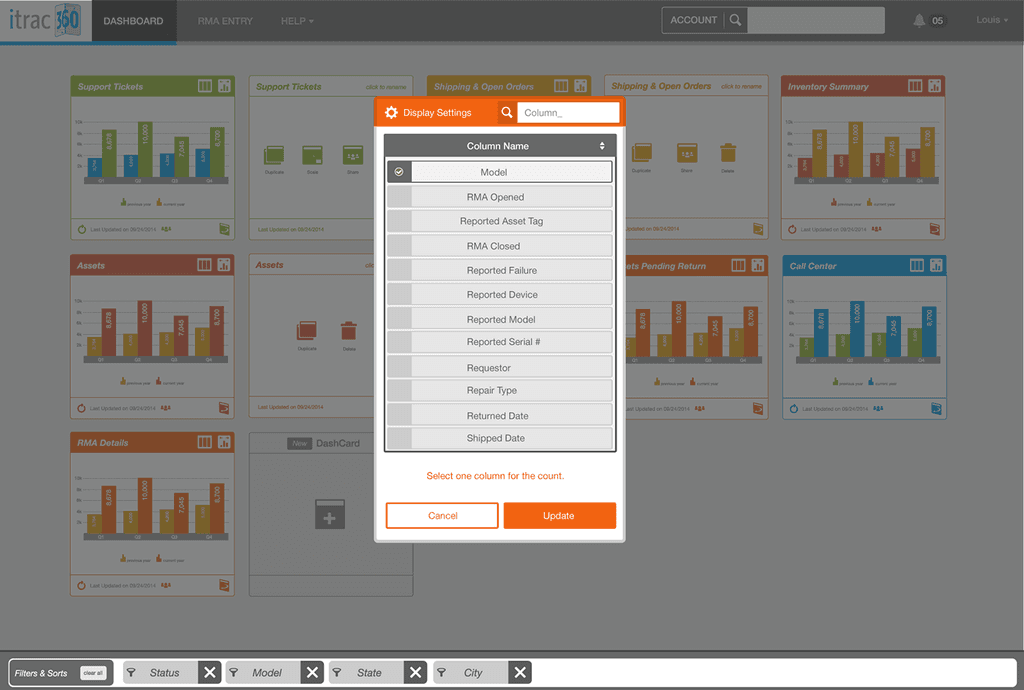
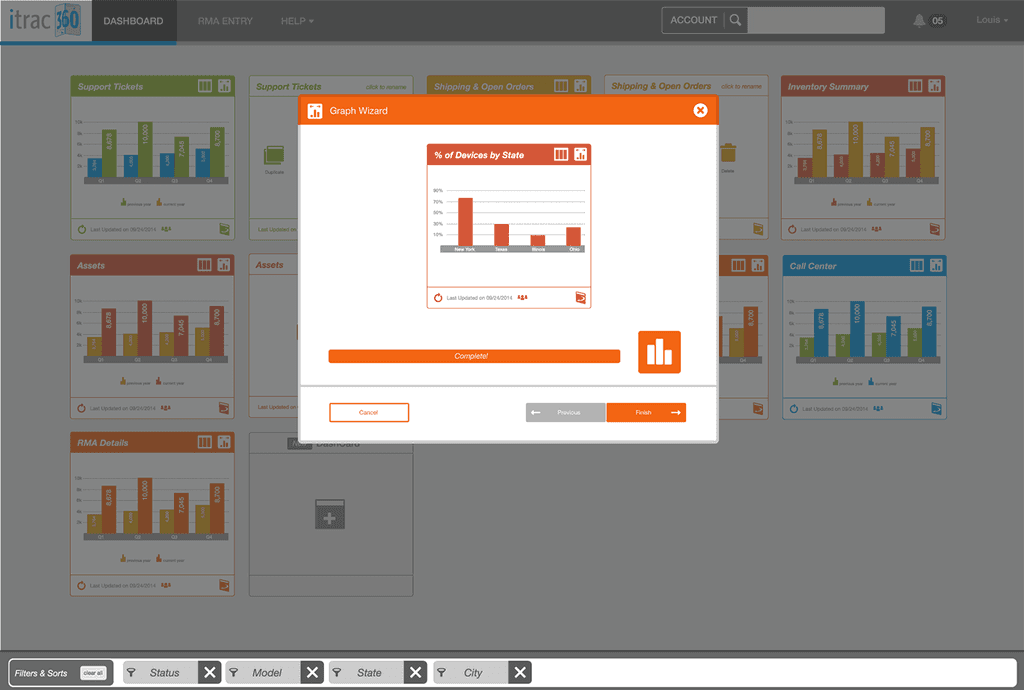
The Graph Wizard
In order to create the custom visuals for the dashboard we needed to create a dedicated tool that could be configured to show a multitude of data types and visuals.
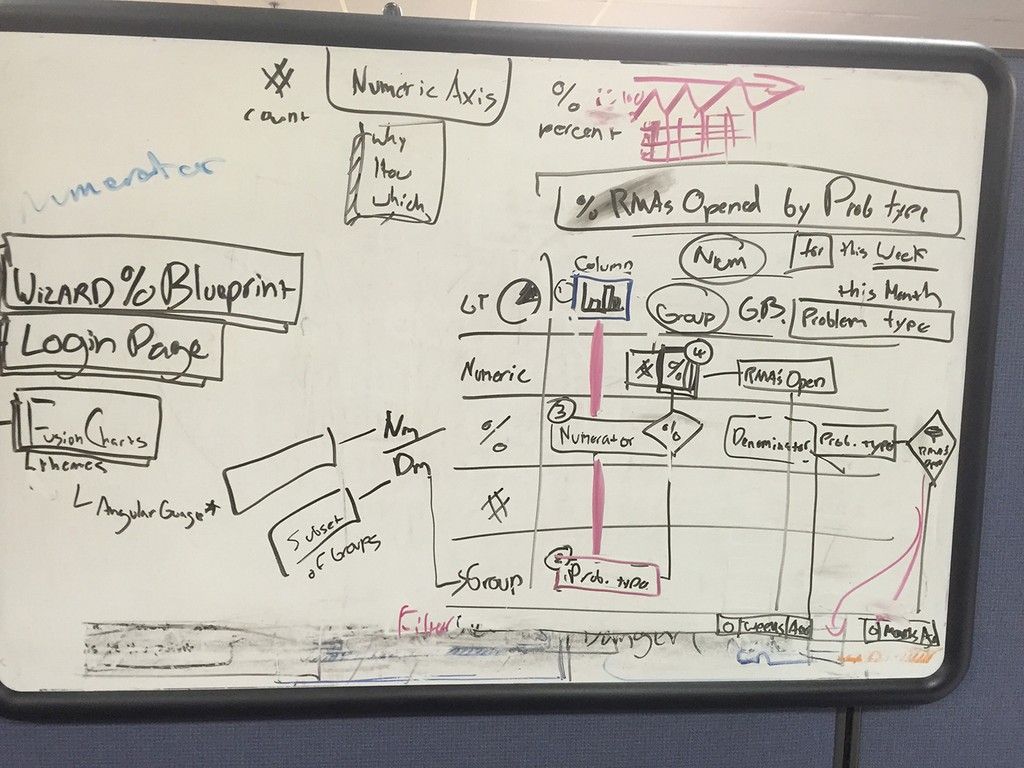
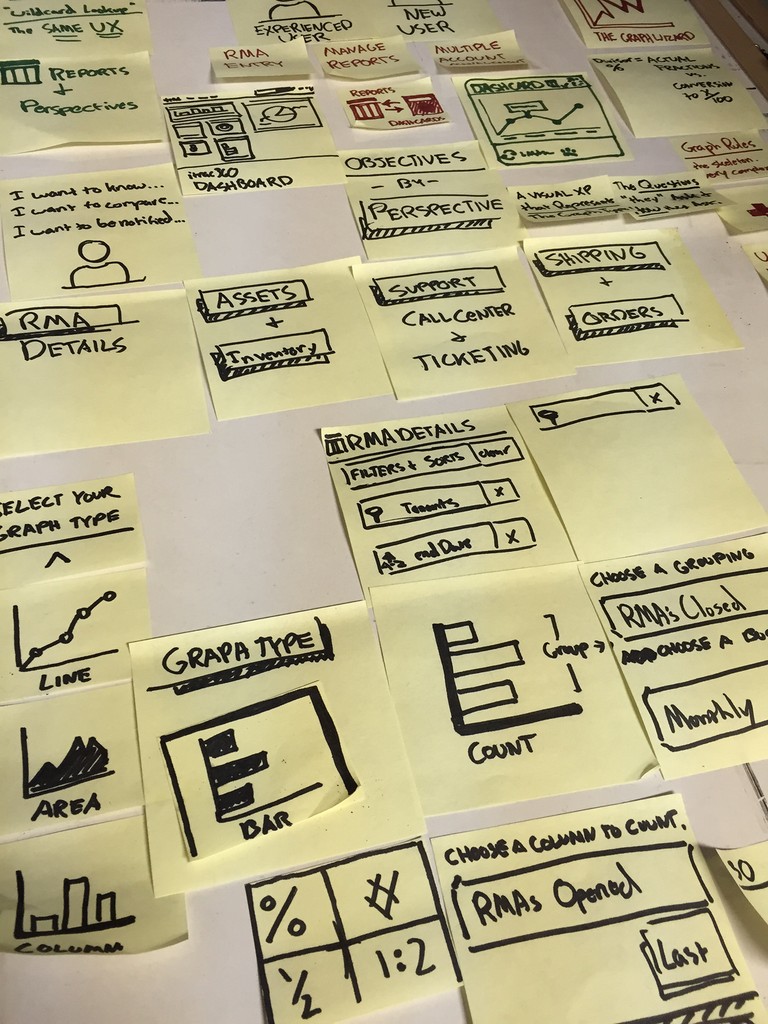
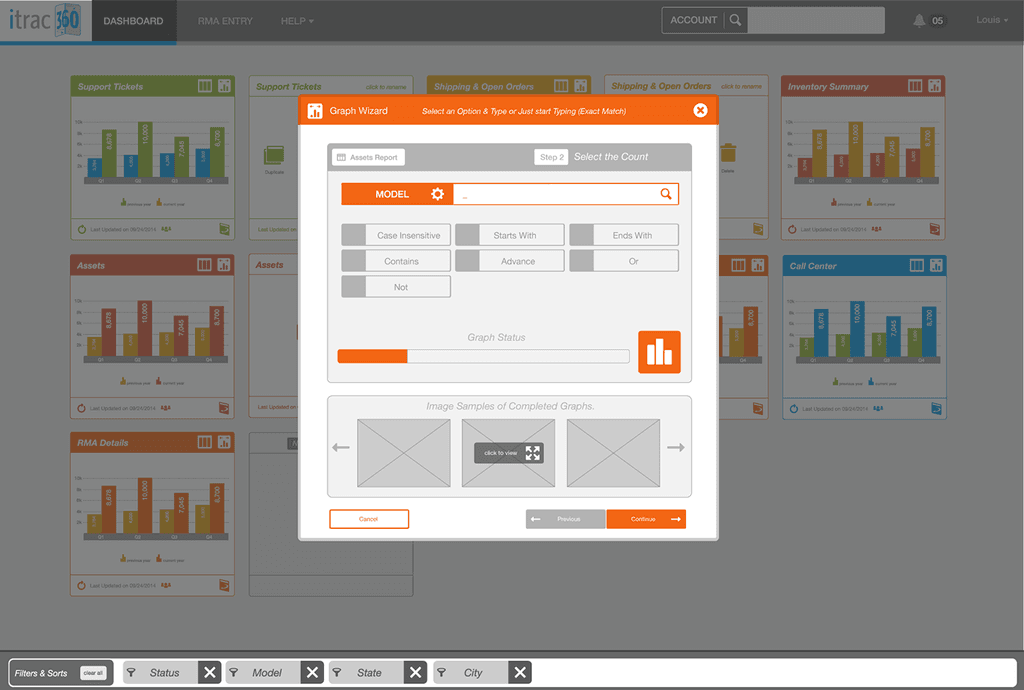
Initially we assumed a linear progression would be the ideal user flow. This would allow the user to focus on each step, and wouldn't overwhelm them with content.
From doing some quick click throughs with users it was clear that the modal experience was cramped, and also created confusion as to what would be saved when navigating back through each step. We needed to create a concept that could be completed on a single page, keeping the user in context.
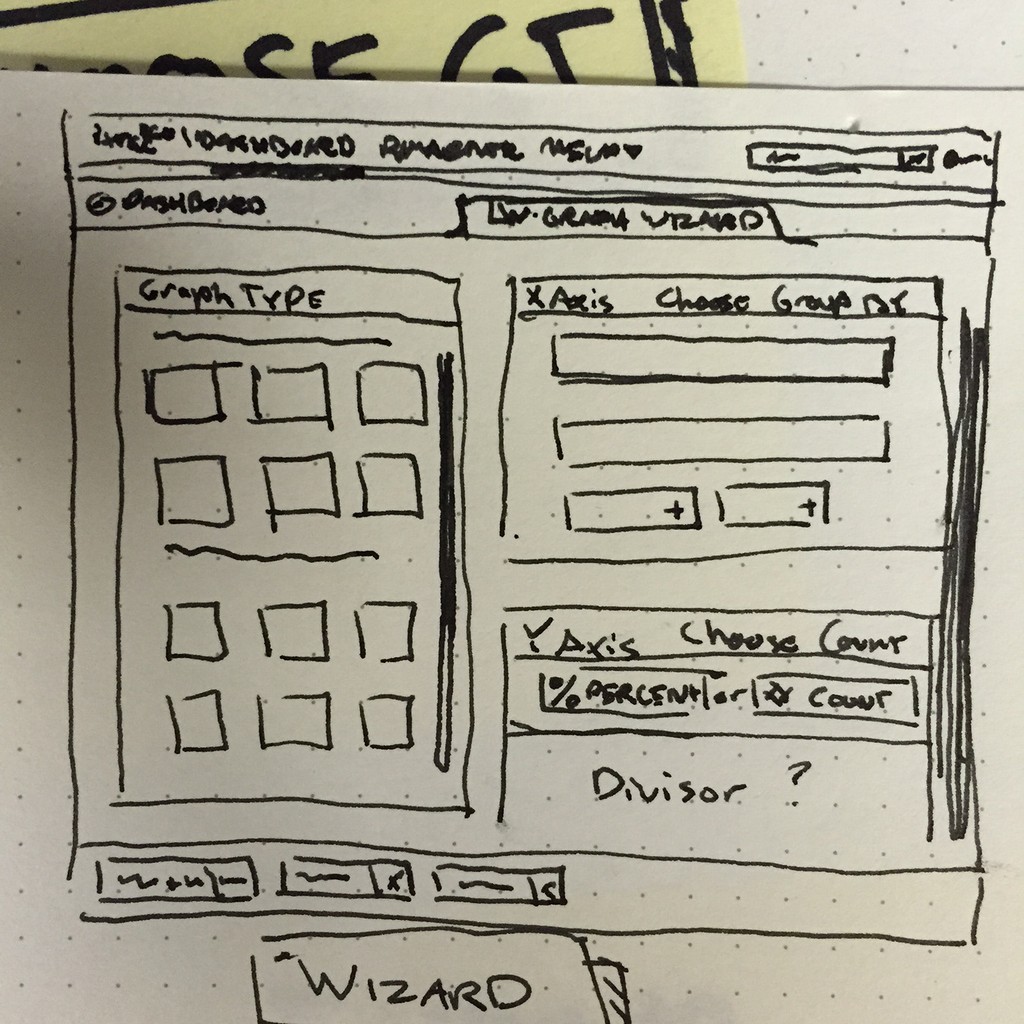
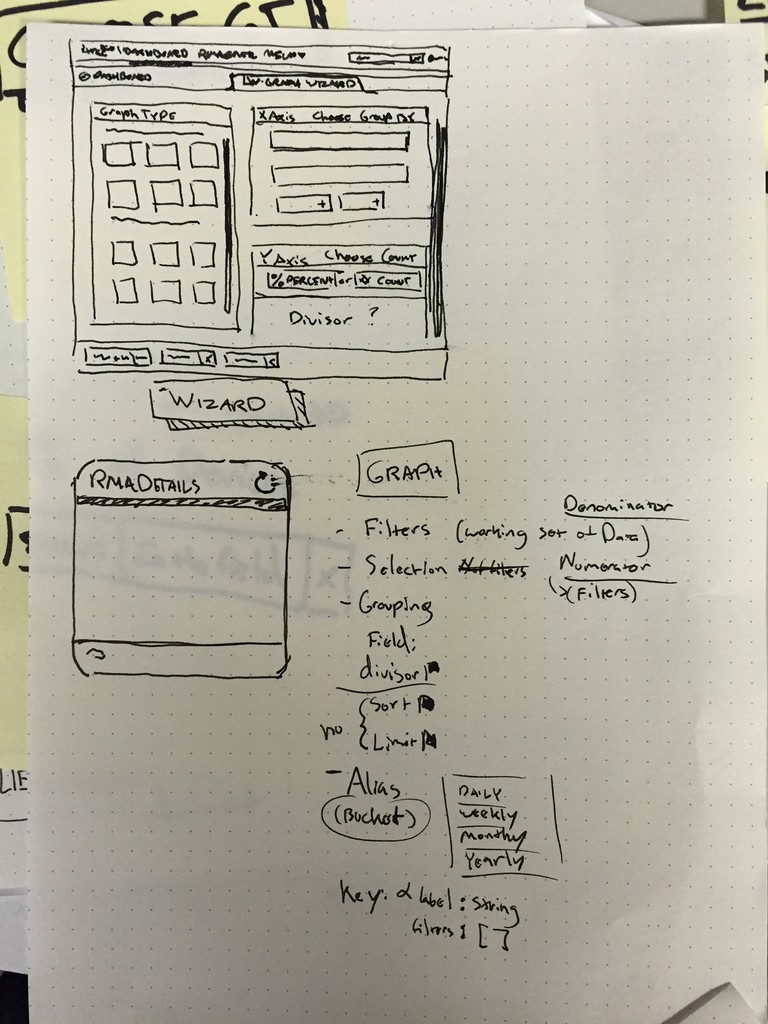
This sketch shows the single page concept, where users can see everything that needs to be configured. The major problem with a linear process is that, in order to make a change you would have to navigate back or start over.
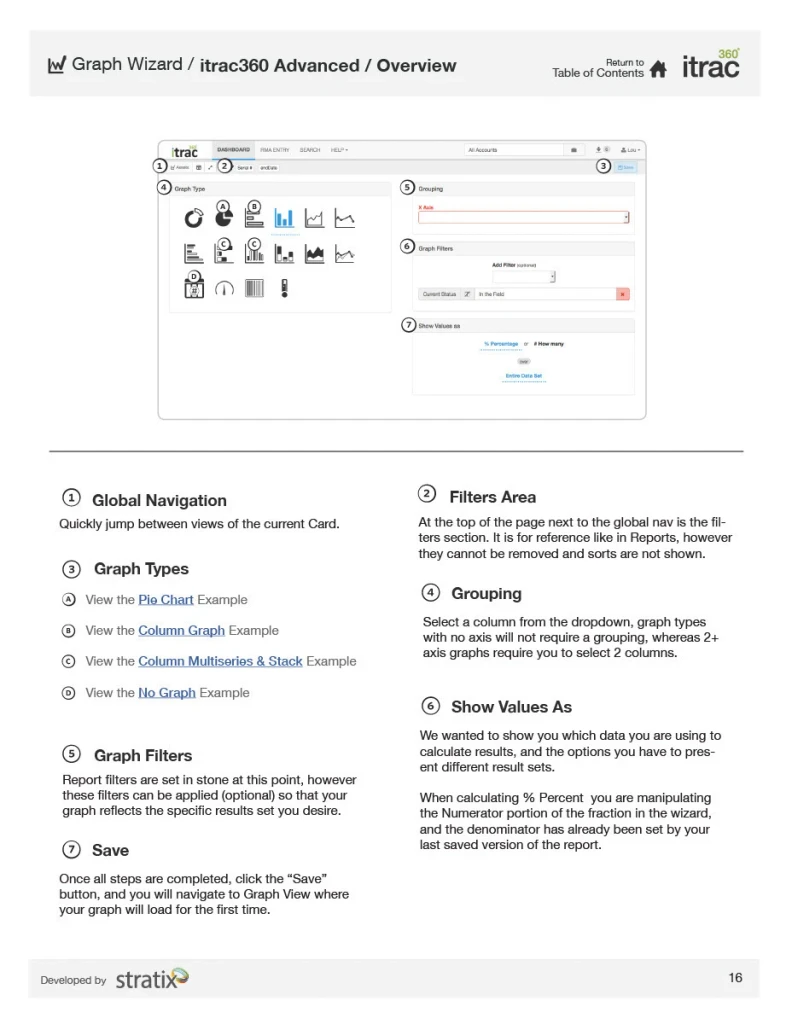
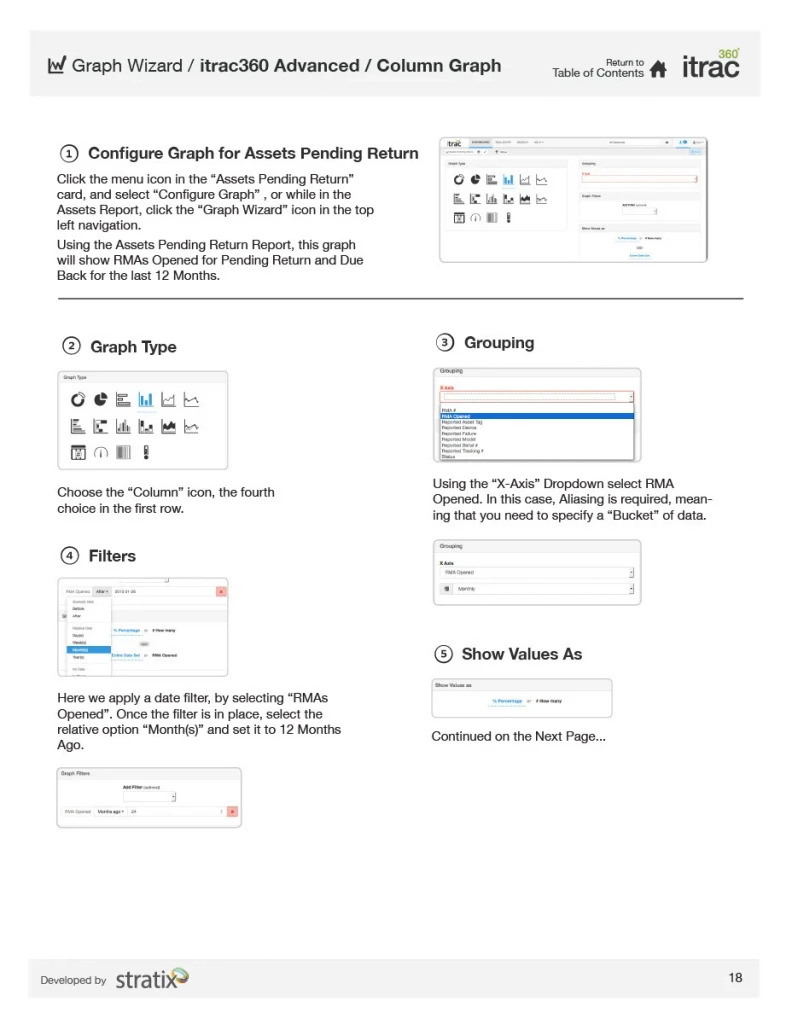
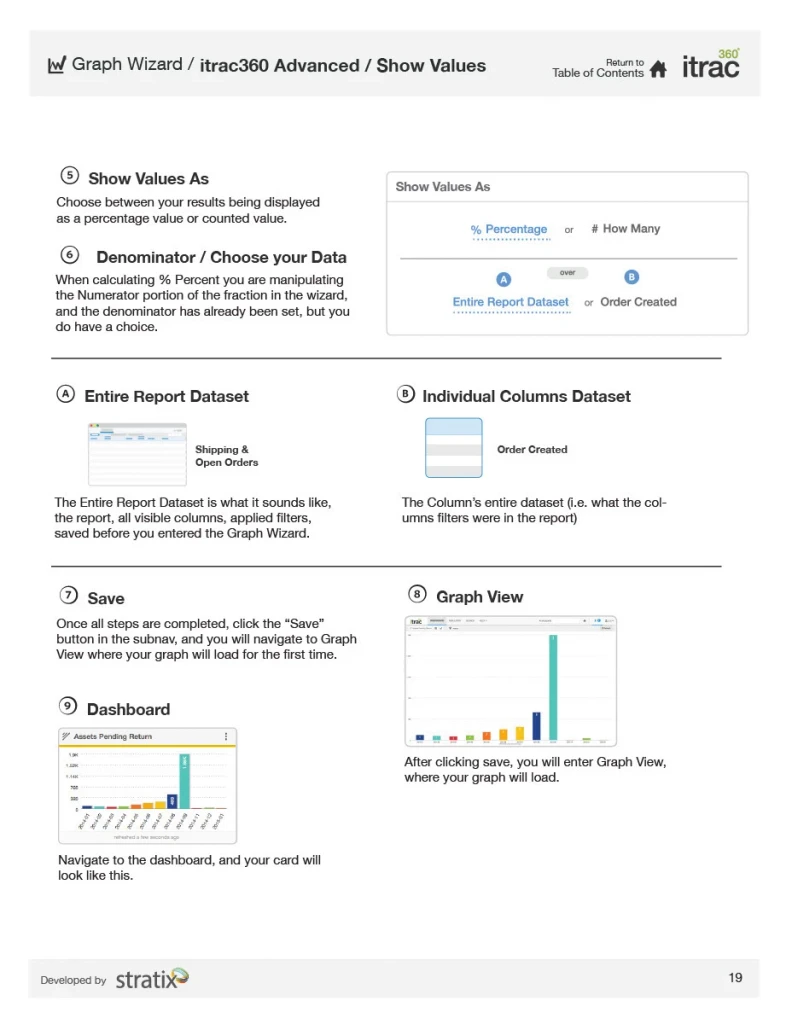
Graph Wizard Final Design & Documentation
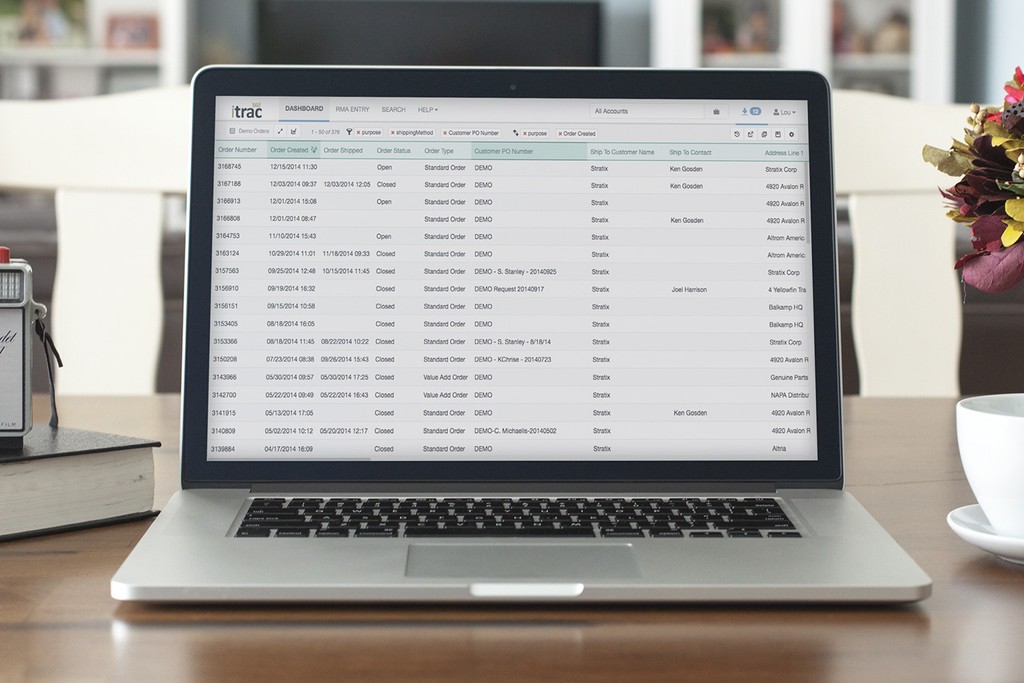
iTrac360 Release and Reception
"We've designed every feature in the next-generation itrac360 hand in hand with our customers to ensure they have the access and control they need over their mobile ecosystem,"
"itrac360 is the bridge that delivers full visibility and assurance to the always-on, always-available mobile enterprise." - Chris Koterski, chief technology officer of Stratix Corporation.
Executives were very excited about the release of itrac, and with good reason. It was very popular with Stratix customers and employees. No longer would they have to keep track of disparate spreadsheets or rely on segmented communication with customers.
In fact itrac is still around in 2025. I am proud to say I was a part of the team that launched itrac 1.0 in 2015.
LouFinkDesign2015
Stratix Corporation | iTrac360